入门指南#
安装 Bokeh#
Bokeh 官方支持并在 Python 3.10 及更高版本(CPython)上进行了测试。
您可以使用 conda 或 pip 安装 Bokeh。
有关安装和可能遇到的问题的更详细信息,请转到 安装详情 部分。
入门指南#
按照这些指南快速了解 Bokeh 最重要的功能和特性。
入门指南适用于任何 Bokeh 新手。使用这些指南的唯一先决条件是对 Python 的基本了解以及 Bokeh 的工作 安装。
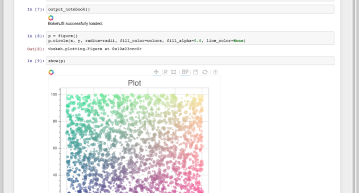
入门指南包含许多您可以复制到开发环境中的示例。如果您想了解入门指南中涵盖的任何主题的更多信息,还有许多指向 用户指南 和 参考指南 中更深入资源的链接。
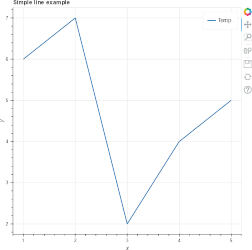
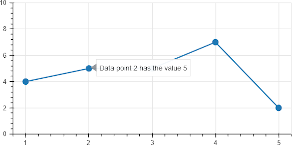
创建简单的折线图
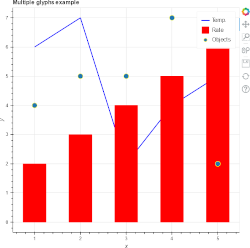
添加和自定义渲染器
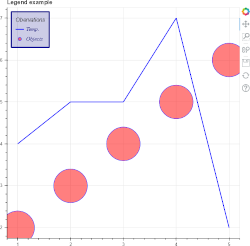
添加图例、文本和注释
自定义图表
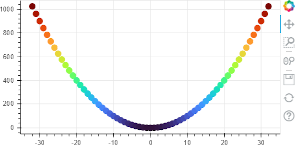
矢量化 Glyph 属性
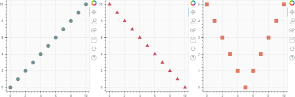
组合图表
显示和导出
提供和过滤数据
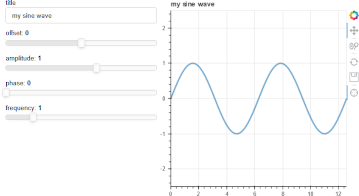
使用小部件